Pay very close attention to images.
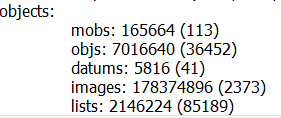
This is after one reboot.
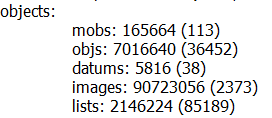
This is after two reboots
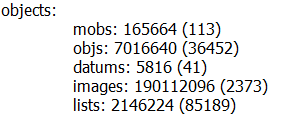
This is after three reboots
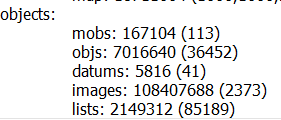
Daemon remains pretty consistent through all of the reboots.

ID:2188696
Dec 19 2016, 3:00 pm
|
|||||||||||||
Resolved
| |||||||||||||
These are all at startup
Pay very close attention to images. This is after one reboot. This is after two reboots This is after three reboots Daemon remains pretty consistent through all of the reboots. | |||||||||||||
Dec 19 2016, 3:38 pm
|
|
Lummox JR
|
I'm convinced this is not a BYOND bug, because I've seen your code. Notice that the image memory is not increasing at a steady rate, but is jumping around. That is inconsistent with a memory leak.
|
I'm convinced this is not a BYOND bug, because I've seen your code. Notice that the image memory is not increasing at a steady rate, but is jumping around. That is inconsistent with a memory leak. I don't see how that's possible given the information he provided. He's got between 9 megs of memory and 178 megs of memory distributed between 2373 /image objects. That means that each /image object has between 3.9kb and 76kb worth of data in them. That's a completely insane amount of data for /image objects in particular to be hanging on to. Where could that data even be coming from? /image objects don't really have any unique space to store that information, so where's all this extra data coming from? Why isn't it consistent on reboots when the number of objects in the world is 100% consistent every time? It doesn't make any sense that this isn't a BYOND bug, because I can't picture a way to make something like this happen. | |
Hrm. Maybe there's a point there. I'll move it back to Bugs for now.
Mav, I need you to edit the report and put in an actual version number up there. "Latest Stable" is not a version number. I'd be willing to entertain the idea that this could be a mutable appearance thing, except those are new to 511 and wouldn't be able to show up as a problem in 510. | |
I believe we've also been having crashes coming from a similar problem (judging from our memory stats). First started around the time we switched to the 511 release? I had yet to take the time to buckle down and try to diagnose it.
| |
I am experiencing a similar issue. DreamDaemon hangs until manually restarted. It actively refuses connections and makes the game it's hosting completely unplayable. It requires the instance to be closed, and reopened - simply rebooting won't do anything. I'm running the latest beta on both the machine that compiled the game files and the server.
The server runs Windows Server 2012 R2.   | |
im having issues with reboot as well but idk if its related to this
| |
I think on review I'm going to need a new copy of this source. The problem with the image memory would have to come from vars; nothing else can explain the discrepancy.
Crazah, your source would probably be helpful for this too, especially if you can point out a way to get the image memory to that state without needing a lot of players to be on. | |
Test case: Here
Run the project, use the "test" verb, then observe image memory. The test case can reproduce the problem as-is on my machine. Unfortunately, throughout my tests, I could not pinpoint a single cause. Images just seem to bloat in general, only less than 10% (at most) of the time not exhibiting this behavior. You should have no problem seeing the issue though. I also think I'm seeing some of the same weirdness with datums, but more investigation is needed. | |
Your test case was very helpful. Thanks.
It turns out this is not a memory leak. It is a bug, but the bug is in the reporting. If an image has no vars set yet, and therefore no array allocated, the var that says the allocated size may be a nonsense value. The SizeOfVar() function was simply multiplying varM by sizeof(Var2) to get the allocation size, but it wasn't checking the actual array to see if it was non-null. varM doesn't get defined until an array is allocated, and then it always describes the number of vars allocated (while varS is the number of vars actually used). This problem actually extends to other types as well, like objs and such, but it's very common for them to have vars which is why it's not as apparent for them. | |
Lummox JR resolved issue with message:
Memory reporting for various types was incorrect for objects that can have user-defined vars but didn't change them. The report was artificially high for those objects, especially for images which typically don't have any non-appearance vars set at all. This gave projects the appearance of having a memory leak when they didn't. | |